A Simple Time Series Analysis Of The S&P 500 Index
16th June 2015In this blog post we'll examine some common techniques used in time series analysis by applying them to a data set containing daily closing values for the S&P 500 stock market index from 1950 up to present day. The objective is to explore some of the basic ideas and concepts from time series analysis, and observe their effects when applied to a real world data set. Although it's not possible to actually predict changes in the index using these techniques, the ideas presented here could theoretically be used as part of a larger strategy involving many additional variables to conduct a regression or machine learning effort.
Time series analysis is a branch of statistics that involves reasoning about ordered sequences of related values in order to extract meaningful statistics and other characteristics of the data. It's used in a wide range of disciplines including econometrics, signal processing, weather forecasting, and basically any other field that involves time series data. These techniques are often used to develop models that can be used to attempt to forecast future values of a series, either on their own or in concert with other variables.
To get started, let's first download the data. I got the historial data set from Yahoo Finance, which includes a link to download the whole thing as a .csv file. Now we can load up the data set and take a look. I'll be using several popular Python libraries for the analysis, so all of the code is in Python.
%matplotlib inline
import os
import numpy as np
import pandas as pd
import matplotlib.pyplot as plt
import statsmodels.api as sm
import seaborn as sb
sb.set_style('darkgrid')
path = os.getcwd() + '\data\stock_data.csv'
stock_data = pd.read_csv(path)
stock_data['Date'] = stock_data['Date'].convert_objects(convert_dates='coerce')
stock_data = stock_data.sort_index(by='Date')
stock_data = stock_data.set_index('Date')
The data is in reverse chronological order so I sorted it by date and then set the index of the data frame to the date column. If you look at the data there are several fields but we'll be focusing on the closing price only. Let's plot the data first and see what it looks like.
stock_data['Close'].plot(figsize=(16, 12))
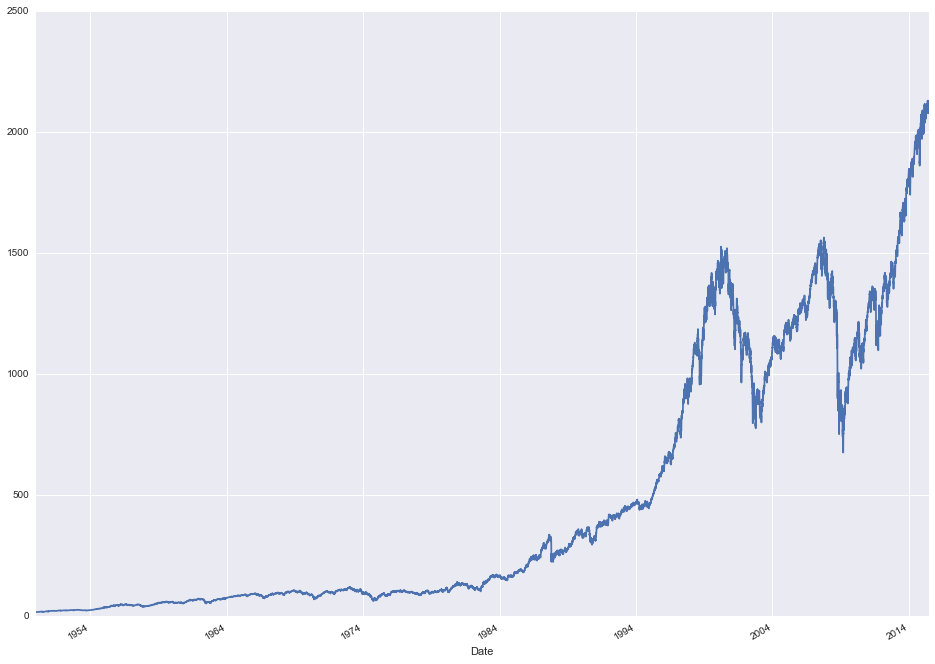
The first obvious thing to note, aside from the two giant dips at the tail end corresponding to the market crashes in 2002 and 2008, is that the data is clearly non-stationary. This makes sense for market data as it tends to go up in the long run more than it goes down. This is a problem for time series analysis though as non-stationary data is hard to reason about. The first thing we can try is a first difference of the series. In other words, subtract the previous value t-1 from the current value t to get the difference d(t).
stock_data['First Difference'] = stock_data['Close'] - stock_data['Close'].shift()
stock_data['First Difference'].plot(figsize=(16, 12))
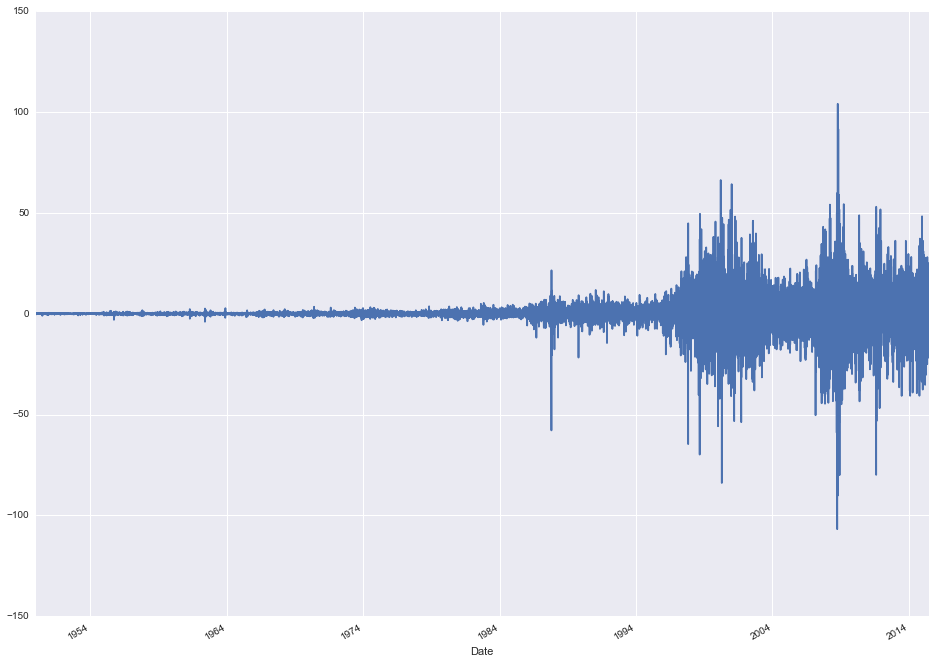
The data no longer appears to be trending up over time and is instead centered around 0. There's another problem though. Look at the variance. It's very small early on and steadily increases over time. This is a sign that the data is not only non-stationary but also exponentially increasing. The magnitude of the day-to-day variations at present day completely dwarf the magnitude of the changes in 1950. To deal with this, we'll apply a log transform to the original series.
stock_data['Natural Log'] = stock_data['Close'].apply(lambda x: np.log(x))
stock_data['Natural Log'].plot(figsize=(16, 12))
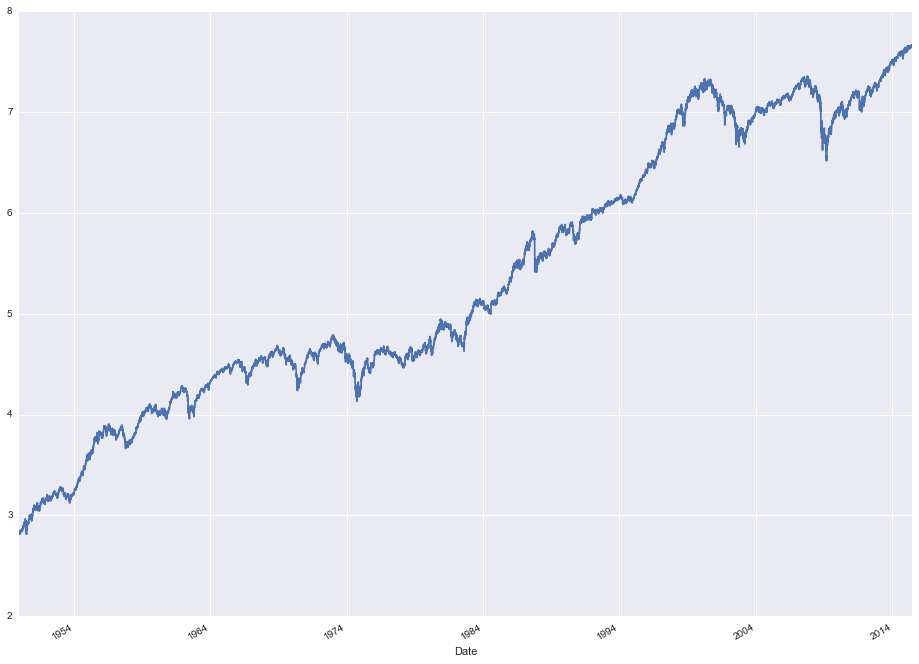
So that gives us the original closing price with a log transform applied to "flatten" the data from an exponential curve to a linear curve. One way to visually see the effect that the log transform had is to analyze the variance over time. We can use a rolling variance statistic and compare both the original series and the logged series.
stock_data['Original Variance'] = pd.rolling_var(stock_data['Close'], 30, min_periods=None, freq=None, center=True)
stock_data['Log Variance'] = pd.rolling_var(stock_data['Natural Log'], 30, min_periods=None, freq=None, center=True)
fig, ax = plt.subplots(2, 1, figsize=(13, 12))
stock_data['Original Variance'].plot(ax=ax[0], title='Original Variance')
stock_data['Log Variance'].plot(ax=ax[1], title='Log Variance')
fig.tight_layout()
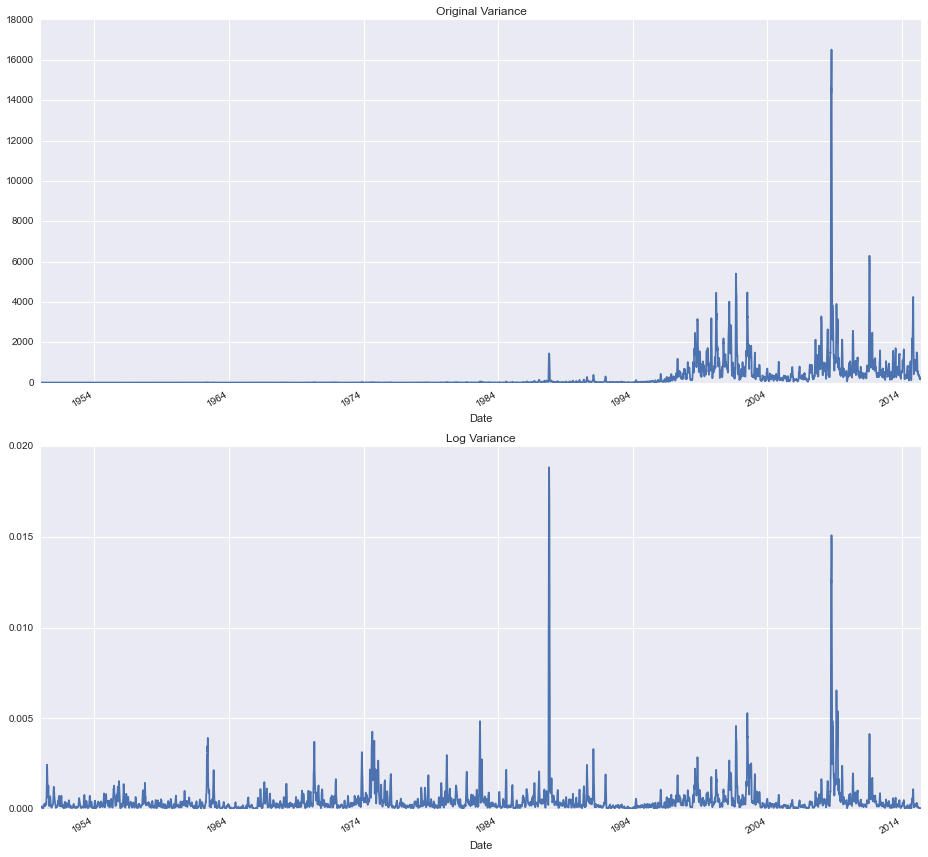
Observe that in the top graph, we can't even see any of the variations until the late 80s. In the bottom graph however it's a different story, changes in the value are clearly visible throughout the entire data set. From this view, it's clear that our transformation has made the variance relatively constant.
Now we can see the earlier variations in the data set quite a bit better than before. We still need to take the first difference though so let's calculate that from the logged series.
stock_data['Logged First Difference'] = stock_data['Natural Log'] - stock_data['Natural Log'].shift()
stock_data['Logged First Difference'].plot(figsize=(16, 12))
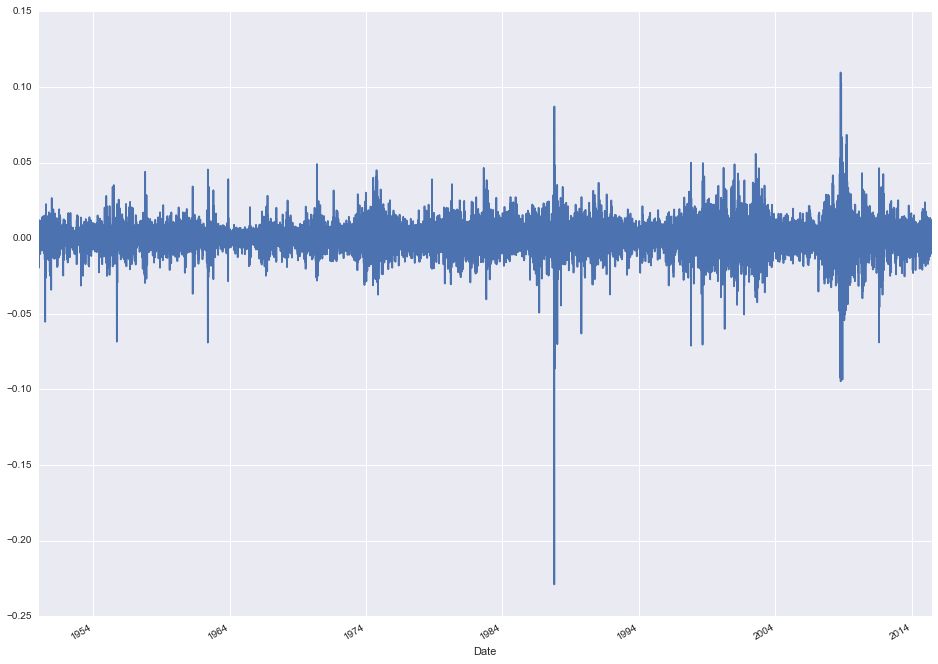
Much better! We now have a stationary time series model of daily changes to the S&P 500 index. Now let's create some lag variables y(t-1), y(t-2) etc. and examine their relationship to y(t). We'll look at 1 and 2-day lags along with weekly and monthly lags to look for "seasonal" effects.
stock_data['Lag 1'] = stock_data['Logged First Difference'].shift()
stock_data['Lag 2'] = stock_data['Logged First Difference'].shift(2)
stock_data['Lag 5'] = stock_data['Logged First Difference'].shift(5)
stock_data['Lag 30'] = stock_data['Logged First Difference'].shift(30)
One interesting visual way to evaluate the relationship between lagged variables is to do a scatter plot of the original variable vs. the lagged variable and see where the distribution lies. We can do this with a joint plot using the seaborn package.
sb.jointplot('Logged First Difference', 'Lag 1', stock_data, kind='reg', size=13)
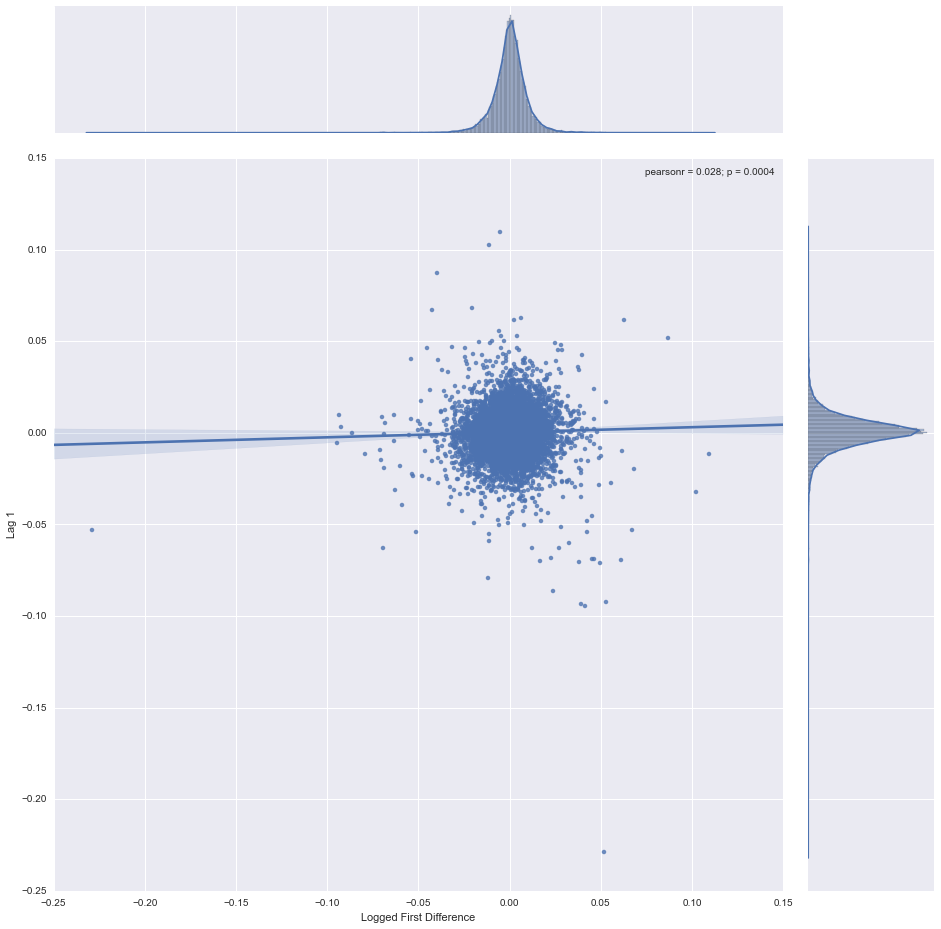
Notice how tightly packed the mass is around 0. It also appears to be pretty evenly distributed - the marginal distributions on both axes are roughly normal. This seems to indicate that knowing the index value one day doesn't tell us much about what it will do the next day.
It probably comes as no surprise that there's very little correlation between the change in value from one day to the next. Although I didn't plot them out here, the other lagged variables that we created above show similar results. There could be a relationship to other lag steps that we haven't tried, but it's impractical to test every possible lag value manually. Fortunately there is a class of functions that can systematically do this for us.
from statsmodels.tsa.stattools import acf
from statsmodels.tsa.stattools import pacf
lag_correlations = acf(stock_data['Logged First Difference'].iloc[1:])
lag_partial_correlations = pacf(stock_data['Logged First Difference'].iloc[1:])
The auto-correlation function computes the correlation between a variable and itself at each lag step up to some limit (in this case 40). The partial auto-correlation function computes the correlation at each lag step that is NOT already explained by previous, lower-order lag steps. We can plot the results to see if there are any significant correlations.
fig, ax = plt.subplots(figsize=(16,12))
ax.plot(lag_correlations, marker='o', linestyle='--')
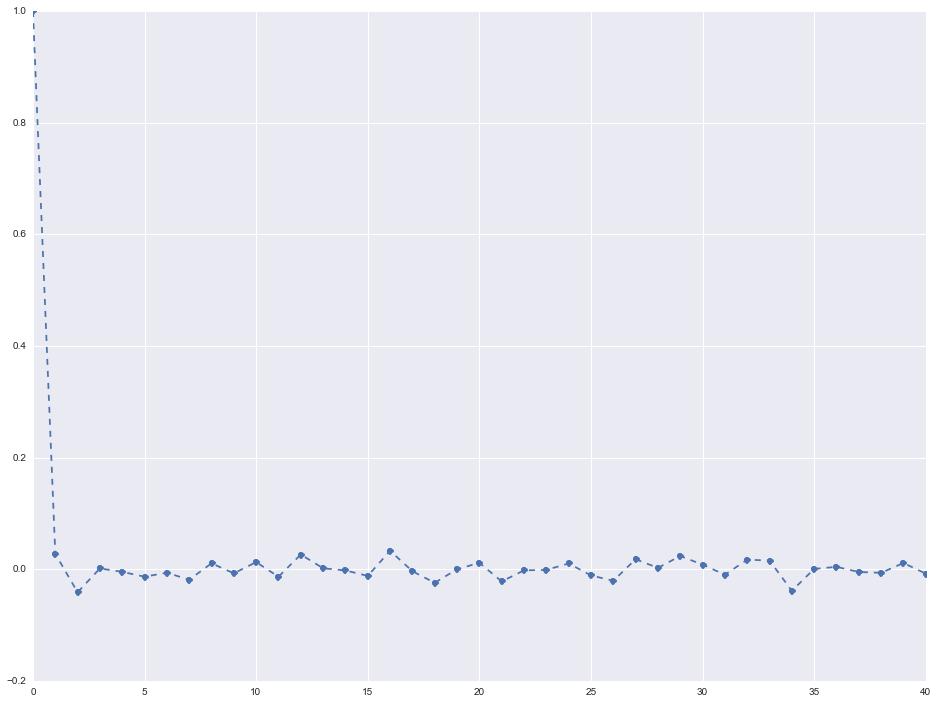
The auto-correlation and partial-autocorrelation results are very close to each other (I only plotted the auto-correlation results above). What this shows is that there is no significant (> 0.2) correlation between the value at time t and at any time prior to t up to 40 steps behind. In order words, the series is a random walk.
Another interesting technique we can try is a decomposition. This is a technique that attempts to break down a time series into trend, seasonal, and residual factors. Statsmodels comes with a decompose function out of the box.
from statsmodels.tsa.seasonal import seasonal_decompose
decomposition = seasonal_decompose(stock_data['Natural Log'], model='additive', freq=30)
fig = plt.figure()
fig = decomposition.plot()
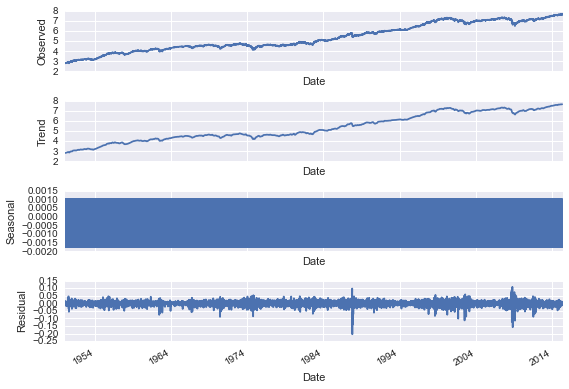
Since we don't see any real cycle in the data, the visualization is not that effective in this case. For data where this is a strong seasonal pattern though it can be very useful. The folling instance, for example, is a sample from the statsmodels documentation showing CO2 emissions data over time.
co2_data = sm.datasets.co2.load_pandas().data
co2_data.co2.interpolate(inplace=True)
result = sm.tsa.seasonal_decompose(co2_data.co2)
fig = plt.figure()
fig = result.plot()
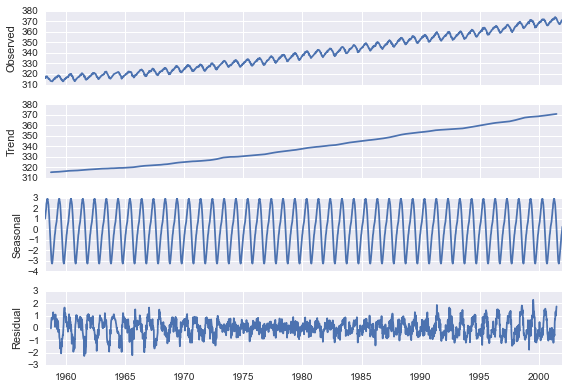
The decomposition is much more useful in this case. There are three clearly distinct components to the time series - a trend line, a seasonal adjustment, and residual values. Each of these would need to be accounted for and modeled appropriately.
Going back to our stock data, we're already observed that it's a random walk and that our lagged variables don't seem to have much impact, but we can still try fitting some ARIMA models and see what we get. Let's start with a simple moving average model.
model = sm.tsa.ARIMA(stock_data['Natural Log'].iloc[1:], order=(1, 0, 0))
results = model.fit(disp=-1)
stock_data['Forecast'] = results.fittedvalues
stock_data[['Natural Log', 'Forecast']].plot(figsize=(16, 12))
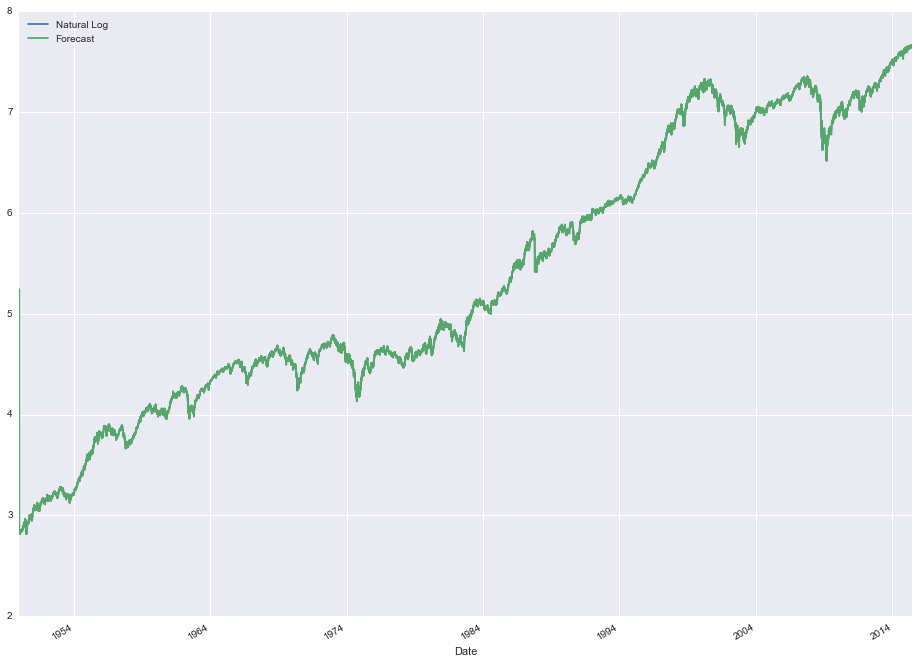
So at first glance it seems like this model is doing pretty well. But although it appears like the forecasts are really close (the lines are almost indistinguishable after all), remember that we used the un-differenced series! The index only fluctuates a small percentage day-to-day relative to the total absolute value. What we really want is to predict the first difference, or the day-to-day moves. We can either re-run the model using the differenced series, or add an "I" term to the ARIMA model (resulting in a (1, 1, 0) model) which should accomplish the same thing. Let's try using the differenced series.
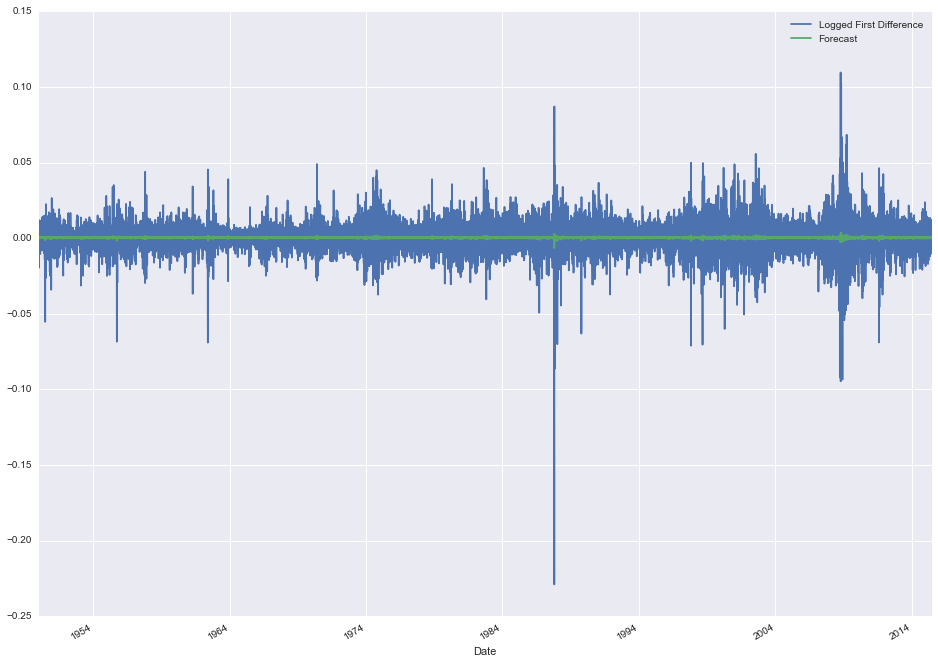
model = sm.tsa.ARIMA(stock_data['Logged First Difference'].iloc[1:], order=(1, 0, 0))
results = model.fit(disp=-1)
stock_data['Forecast'] = results.fittedvalues
stock_data[['Logged First Difference', 'Forecast']].plot(figsize=(16, 12))
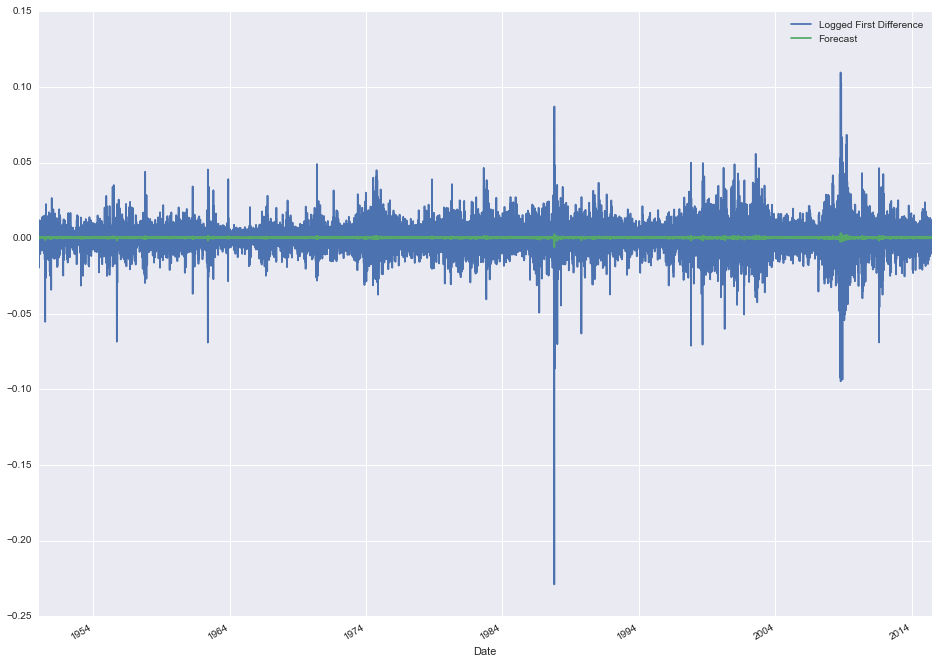
It's a little hard to tell, but it appears like our forecasted changes are generally much smaller than the actual changes. It might be worth taking a closer look at a subset of the data to see what's really going on.
stock_data[['Logged First Difference', 'Forecast']].iloc[1200:1600, :].plot(figsize=(16, 12))
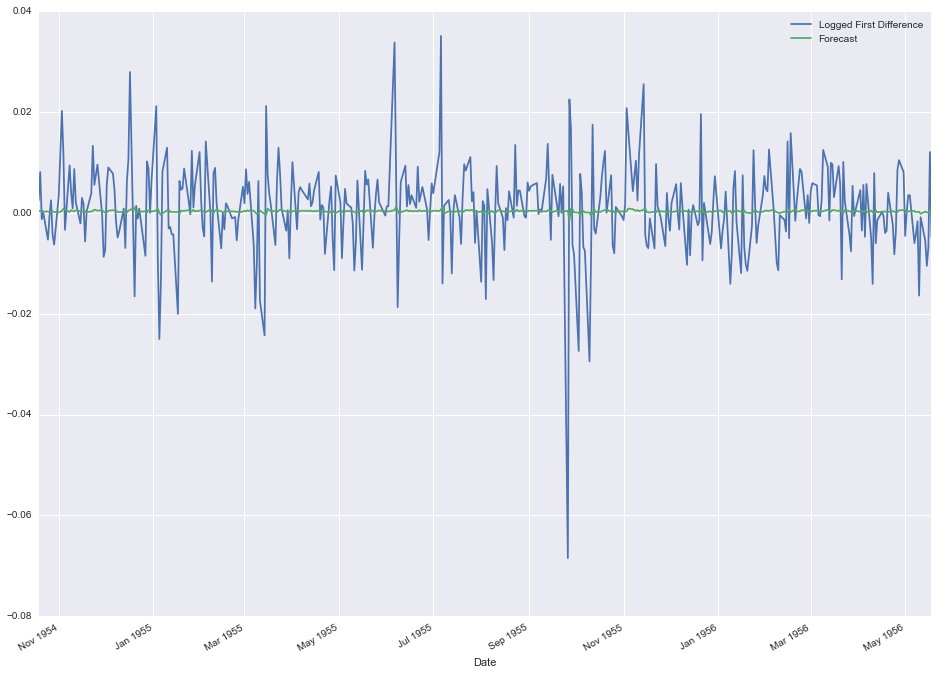
So now it's pretty obvious that the forecast is way off. We're predicting tiny little variations relative to what is actually happening day-to-day. Again, this is more of less expected with a simple moving average model of a random walk time series. There's not enough information from the previous days to accurately forcast what's going to happen the next day.
A moving average model doesn't appear to do so well. What about an exponential smoothing model? Exponential smoothing spreads out the impact of previous values using an exponential weighting, so things that happened more recently are more impactful than things that happened a long time ago. Maybe this "smarter" form of averaging will be more accurate?
model = sm.tsa.ARIMA(stock_data['Logged First Difference'].iloc[1:], order=(0, 0, 1))
results = model.fit(disp=-1)
stock_data['Forecast'] = results.fittedvalues
stock_data[['Logged First Difference', 'Forecast']].plot(figsize=(16, 12))
You can probably guess the answer...if predicting the stock market were this easy, everyone would be doing it! As I mentioned at the top, the point of this analysis wasn't to claim that you can predict the market with these techniques, but rather to demonstrate the types of the analysis one might use when breaking down time series data. Time series analysis is a very rich field with lots more technical analysis than what I went into here (much of which I'm still learning). If you're interested in doing a deeper dive, I recommend these notes from a professor at Duke. A lot of what I learned about the field I picked up from reading online resources like this one. Finally, the original source code from this post is hosted on GitHub here, along with a variety of other notebooks. Feel free to check it out!