Machine Learning Exercises In Python, Part 8
12th August 2016This post is part of a series covering the exercises from Andrew Ng's machine learning class on Coursera. The original code, exercise text, and data files for this post are available here.
Part 1 - Simple Linear Regression
Part 2 - Multivariate Linear Regression
Part 3 - Logistic Regression
Part 4 - Multivariate Logistic Regression
Part 5 - Neural Networks
Part 6 - Support Vector Machines
Part 7 - K-Means Clustering & PCA
Part 8 - Anomaly Detection & Recommendation
We've now reached the last post in this series! It's been an interesting journey. Andrew's class was really well-done and translating it all to python has been a fun experience. In this final installment we'll cover the last two topics in the course - anomaly detection and recommendation systems. We'll implement an anomaly detection algorithm using a Gaussian model and apply it to detect failing servers on a network. We'll also see how to build a recommendation system using collaborative filtering and apply it to a movie recommendations data set. As always, it helps to follow along using the exercise text for the course (posted here).
Anomaly Detection
Our first task is to use a Gaussian model to detect if an unlabeled example from a data set should be considered an anomaly. We have a simple 2-dimensional data set to start off with so we can easily visualize what the algorithm is doing. Let's pull in and plot the data.
import numpy as np
import pandas as pd
import matplotlib.pyplot as plt
import seaborn as sb
from scipy.io import loadmat
%matplotlib inline
data = loadmat('data/ex8data1.mat')
X = data['X']
X.shape
(307L, 2L)
fig, ax = plt.subplots(figsize=(12,8))
ax.scatter(X[:,0], X[:,1])
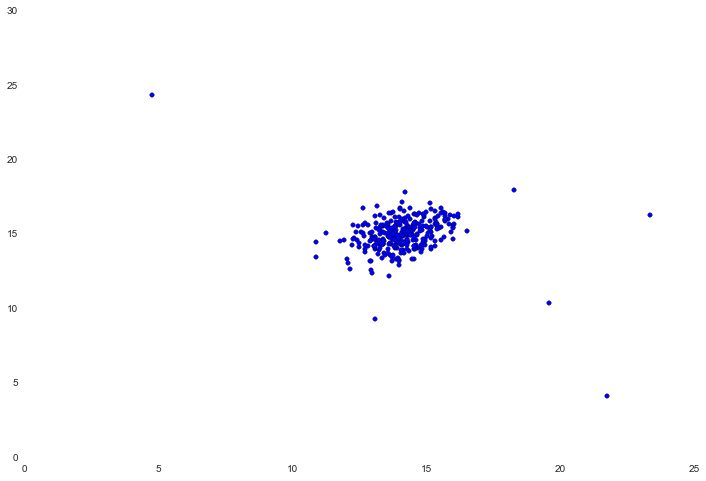
It appears that there's a pretty tight cluster in the center with several values further out away from the cluster. In this simple example, these could be considered anomalies. To find out, we're tasked with estimating a Gaussian distribution for each feature in the data. You may recall that to define a probability distribution we need two things - mean and variance. To accomplish this we'll create a simple function that calculates the mean and variance for each feature in our data set.
def estimate_gaussian(X):
    mu = X.mean(axis=0)
    sigma = X.var(axis=0)
    return mu, sigma
mu, sigma = estimate_gaussian(X)
mu, sigma
(array([ 14.11222578, 14.99771051]), array([ 1.83263141, 1.70974533]))
Now that we have our model parameters, we need to determine a probability threshold which indicates that an example should be considered an anomaly. To do this, we need to use a set of labeled validation data (where the true anomalies have been marked for us) and test the model's performance at identifying those anomalies given different threshold values.
Xval = data['Xval']
yval = data['yval']
Xval.shape, yval.shape
((307L, 2L), (307L, 1L))
We also need a way to calculate the probability that a data point belongs to a normal distribution given some set of parameters. Fortunately SciPy has this built-in.
from scipy import stats
dist = stats.norm(mu[0], sigma[0])
dist.pdf(X[:,0])[0:50]
array([ 0.183842  ,  0.20221694,  0.21746136,  0.19778763,  0.20858956,
        0.21652359,  0.16991291,  0.15123542,  0.1163989 ,  0.1594734 ,
        0.21716057,  0.21760472,  0.20141857,  0.20157497,  0.21711385,
        0.21758775,  0.21695576,  0.2138258 ,  0.21057069,  0.1173018 ,
        0.20765108,  0.21717452,  0.19510663,  0.21702152,  0.17429399,
        0.15413455,  0.21000109,  0.20223586,  0.21031898,  0.21313426,
        0.16158946,  0.2170794 ,  0.17825767,  0.17414633,  0.1264951 ,
        0.19723662,  0.14538809,  0.21766361,  0.21191386,  0.21729442,
        0.21238912,  0.18799417,  0.21259798,  0.21752767,  0.20616968,
        0.21520366,  0.1280081 ,  0.21768113,  0.21539967,  0.16913173])
In case it isn't clear, we just calculated the probability that each of the first 50 instances of our data set's first dimension belong to the distribution that we defined earlier by calculating the mean and variance for that dimension. Essentially it's computing how far each instance is from the mean and how that compares to the "typical" distance from the mean for this data.
Let's compute and save the probability density of each of the values in our data set given the Gaussian model parameters we calculated above.
p = np.zeros((X.shape[0], X.shape[1]))
p[:,0] = stats.norm(mu[0], sigma[0]).pdf(X[:,0])
p[:,1] = stats.norm(mu[1], sigma[1]).pdf(X[:,1])
p.shape
(307L, 2L)
We also need to do this for the validation set (using the same model parameters). We'll use these probabilities combined with the true label to determine the optimal probability threshold to assign data points as anomalies.
pval = np.zeros((Xval.shape[0], Xval.shape[1]))
pval[:,0] = stats.norm(mu[0], sigma[0]).pdf(Xval[:,0])
pval[:,1] = stats.norm(mu[1], sigma[1]).pdf(Xval[:,1])
Next, we need a function that finds the best threshold value given the probability density values and true labels. To do this we'll calculate the F1 score for varying values of epsilon. F1 is a function of the number of true positives, false positives, and false negatives.
def select_threshold(pval, yval):
    best_epsilon = 0
    best_f1 = 0
    f1 = 0
    step = (pval.max() - pval.min()) / 1000
    for epsilon in np.arange(pval.min(), pval.max(), step):
        preds = pval < epsilon
        tp = np.sum(np.logical_and(preds == 1, yval == 1)).astype(float)
        fp = np.sum(np.logical_and(preds == 1, yval == 0)).astype(float)
        fn = np.sum(np.logical_and(preds == 0, yval == 1)).astype(float)
        precision = tp / (tp + fp)
        recall = tp / (tp + fn)
        f1 = (2 * precision * recall) / (precision + recall)
        if f1 > best_f1:
            best_f1 = f1
            best_epsilon = epsilon
    return best_epsilon, best_f1
epsilon, f1 = select_threshold(pval, yval)
epsilon, f1
(0.0095667060059568421, 0.7142857142857143)
Finally, we can apply the threshold to the data set and visualize the results.
# indexes of the values considered to be outliers
outliers = np.where(p < epsilon)
fig, ax = plt.subplots(figsize=(12,8))
ax.scatter(X[:,0], X[:,1])
ax.scatter(X[outliers[0],0], X[outliers[0],1], s=50, color='r', marker='o')
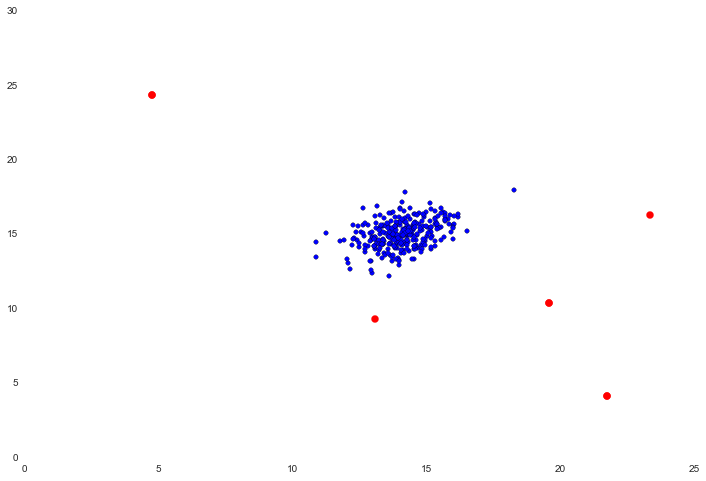
Not bad! The points in red are the ones that were flagged as outliers. Visually these seem pretty reasonable. The top right point that has some separation (but was not flagged) may be an outlier too, but it's fairly close. There's another example in the text of applying this to a higher-dimensional data set, but since it's a trivial extension of the two-dimensional example we'll move on to the last section.
Collaborative Filtering
Recommendation engines use item and user-based similarity measures to examine a user's historical preferences to make recommendations for new "things" the user might be interested in. In this exercise we'll implement a particular recommendation algorithm called collaborative filtering and apply it to a data set of movie ratings. Let's first load and examine the data we'll be working with.
data = loadmat('data/ex8_movies.mat')
data
{'R': array([[1, 1, 0, ..., 1, 0, 0],
        [1, 0, 0, ..., 0, 0, 1],
        [1, 0, 0, ..., 0, 0, 0],
        ...,
        [0, 0, 0, ..., 0, 0, 0],
        [0, 0, 0, ..., 0, 0, 0],
        [0, 0, 0, ..., 0, 0, 0]], dtype=uint8),
 'Y': array([[5, 4, 0, ..., 5, 0, 0],
        [3, 0, 0, ..., 0, 0, 5],
        [4, 0, 0, ..., 0, 0, 0],
        ...,
        [0, 0, 0, ..., 0, 0, 0],
        [0, 0, 0, ..., 0, 0, 0],
        [0, 0, 0, ..., 0, 0, 0]], dtype=uint8),
 '__globals__': [],
 '__header__': 'MATLAB 5.0 MAT-file, Platform: GLNXA64, Created on: Thu Dec  1 17:19:26 2011',
 '__version__': '1.0'}
Y is a (number of movies x number of users) array containing ratings from 1 to 5. R is an "indicator" array containing binary values indicating if a user has rated a movie or not. Both should have the same shape.
Y = data['Y']
R = data['R']
Y.shape, R.shape
((1682L, 943L), (1682L, 943L))
We can look at the average rating for a movie by averaging over a row in Y for indexes where a rating is present.
Y[1,R[1,:]].mean()
2.5832449628844114
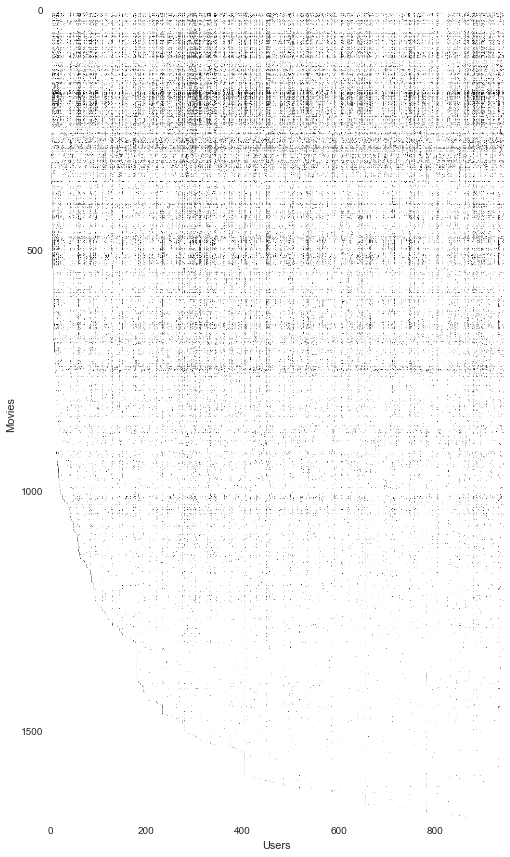
We can also try to "visualize" the data by rendering the matrix as if it were an image. We can't glean too much from this but it does give us an idea of a relative density of ratings across users and movies.
fig, ax = plt.subplots(figsize=(12,12))
ax.imshow(Y)
ax.set_xlabel('Users')
ax.set_ylabel('Movies')
fig.tight_layout()
Next we're going to implement a cost function for collaborative filtering. Intuitively, the "cost" is the degree to which a set of movie rating predictions deviate from the true predictions. The cost equation is given in the exercise text. It is based on two sets of parameter matrices called X and Theta in the text. These are "unrolled" into the "params" input so that we can use SciPy's optimization package later on. Note that I've included the array/matrix shapes in comments to help illustrate how the matrix interactions work.
def cost(params, Y, R, num_features):
    Y = np.matrix(Y)  # (1682, 943)
    R = np.matrix(R)  # (1682, 943)
    num_movies = Y.shape[0]
    num_users = Y.shape[1]
    # reshape the parameter array into parameter matrices
    X = np.matrix(np.reshape(params[:num_movies * num_features], (num_movies, num_features)))  # (1682, 10)
    Theta = np.matrix(np.reshape(params[num_movies * num_features:], (num_users, num_features)))  # (943, 10)
    # initializations
    J = 0
    # compute the cost
    error = np.multiply((X * Theta.T) - Y, R)  # (1682, 943)
    squared_error = np.power(error, 2)  # (1682, 943)
    J = (1. / 2) * np.sum(squared_error)
    return J
In order to test this, we're provided with a set of pre-trained parameters that we can evaluate. To keep the evaluation time down, we'll look at just a small sub-set of the data.
users = 4
movies = 5
features = 3
params_data = loadmat('data/ex8_movieParams.mat')
X = params_data['X']
Theta = params_data['Theta']
X_sub = X[:movies, :features]
Theta_sub = Theta[:users, :features]
Y_sub = Y[:movies, :users]
R_sub = R[:movies, :users]
params = np.concatenate((np.ravel(X_sub), np.ravel(Theta_sub)))
cost(params, Y_sub, R_sub, features)
22.224603725685675
This answer matches what the exercise text said we're supposed to get. Next we need to implement the gradient computations. Just like we did with the neural networks implementation in exercise 4, we'll extend the cost function to also compute the gradients.
def cost(params, Y, R, num_features):
    Y = np.matrix(Y)  # (1682, 943)
    R = np.matrix(R)  # (1682, 943)
    num_movies = Y.shape[0]
    num_users = Y.shape[1]
    # reshape the parameter array into parameter matrices
    X = np.matrix(np.reshape(params[:num_movies * num_features], (num_movies, num_features)))  # (1682, 10)
    Theta = np.matrix(np.reshape(params[num_movies * num_features:], (num_users, num_features)))  # (943, 10)
    # initializations
    J = 0
    X_grad = np.zeros(X.shape)  # (1682, 10)
    Theta_grad = np.zeros(Theta.shape)  # (943, 10)
    # compute the cost
    error = np.multiply((X * Theta.T) - Y, R)  # (1682, 943)
    squared_error = np.power(error, 2)  # (1682, 943)
    J = (1. / 2) * np.sum(squared_error)
    # calculate the gradients
    X_grad = error * Theta
    Theta_grad = error.T * X
    # unravel the gradient matrices into a single array
    grad = np.concatenate((np.ravel(X_grad), np.ravel(Theta_grad)))
    return J, grad
J, grad = cost(params, Y_sub, R_sub, features)
J, grad
(22.224603725685675,
 array([ -2.52899165,   7.57570308,  -1.89979026,  -0.56819597,
          3.35265031,  -0.52339845,  -0.83240713,   4.91163297,
         -0.76677878,  -0.38358278,   2.26333698,  -0.35334048,
         -0.80378006,   4.74271842,  -0.74040871, -10.5680202 ,
          4.62776019,  -7.16004443,  -3.05099006,   1.16441367,
         -3.47410789,   0.        ,   0.        ,   0.        ,
          0.        ,   0.        ,   0.        ]))
Our next step is to add regularization to both the cost and gradient calculations. We'll create one final regularized version of the function (note that this version includes an additional learning rate parameter called "lambda").
def cost(params, Y, R, num_features, learning_rate):
    Y = np.matrix(Y)  # (1682, 943)
    R = np.matrix(R)  # (1682, 943)
    num_movies = Y.shape[0]
    num_users = Y.shape[1]
    # reshape the parameter array into parameter matrices
    X = np.matrix(np.reshape(params[:num_movies * num_features], (num_movies, num_features)))  # (1682, 10)
    Theta = np.matrix(np.reshape(params[num_movies * num_features:], (num_users, num_features)))  # (943, 10)
    # initializations
    J = 0
    X_grad = np.zeros(X.shape)  # (1682, 10)
    Theta_grad = np.zeros(Theta.shape)  # (943, 10)
    # compute the cost
    error = np.multiply((X * Theta.T) - Y, R)  # (1682, 943)
    squared_error = np.power(error, 2)  # (1682, 943)
    J = (1. / 2) * np.sum(squared_error)
    # add the cost regularization
    J = J + ((learning_rate / 2) * np.sum(np.power(Theta, 2)))
    J = J + ((learning_rate / 2) * np.sum(np.power(X, 2)))
    # calculate the gradients with regularization
    X_grad = (error * Theta) + (learning_rate * X)
    Theta_grad = (error.T * X) + (learning_rate * Theta)
    # unravel the gradient matrices into a single array
    grad = np.concatenate((np.ravel(X_grad), np.ravel(Theta_grad)))
    return J, grad
J, grad = cost(params, Y_sub, R_sub, features, 1.5)
J, grad
(31.344056244274221,
 array([ -0.95596339,   6.97535514,  -0.10861109,   0.60308088,
          2.77421145,   0.25839822,   0.12985616,   4.0898522 ,
         -0.89247334,   0.29684395,   1.06300933,   0.66738144,
          0.60252677,   4.90185327,  -0.19747928, -10.13985478,
          2.10136256,  -6.76563628,  -2.29347024,   0.48244098,
         -2.99791422,  -0.64787484,  -0.71820673,   1.27006666,
          1.09289758,  -0.40784086,   0.49026541]))
This result again matches up with the expected output from the exercise code, so it looks like the regularization is working. Before we train the model, we have one final step. We're tasked with creating our own movie ratings so we can use the model to generate personalized recommendations. A file is provided for us that links the movie index to its title. Let's load the file into a dictionary and use some sample ratings provided in the exercise.
movie_idx = {}
f = open('data/movie_ids.txt')
for line in f:
    tokens = line.split(' ')
    tokens[-1] = tokens[-1][:-1]
    movie_idx[int(tokens[0]) - 1] = ' '.join(tokens[1:])
ratings = np.zeros((1682, 1))
ratings[0] = 4
ratings[6] = 3
ratings[11] = 5
ratings[53] = 4
ratings[63] = 5
ratings[65] = 3
ratings[68] = 5
ratings[97] = 2
ratings[182] = 4
ratings[225] = 5
ratings[354] = 5
print('Rated {0} with {1} stars.'.format(movie_idx[0], str(int(ratings[0]))))
print('Rated {0} with {1} stars.'.format(movie_idx[6], str(int(ratings[6]))))
print('Rated {0} with {1} stars.'.format(movie_idx[11], str(int(ratings[11]))))
print('Rated {0} with {1} stars.'.format(movie_idx[53], str(int(ratings[53]))))
print('Rated {0} with {1} stars.'.format(movie_idx[63], str(int(ratings[63]))))
print('Rated {0} with {1} stars.'.format(movie_idx[65], str(int(ratings[65]))))
print('Rated {0} with {1} stars.'.format(movie_idx[68], str(int(ratings[68]))))
print('Rated {0} with {1} stars.'.format(movie_idx[97], str(int(ratings[97]))))
print('Rated {0} with {1} stars.'.format(movie_idx[182], str(int(ratings[182]))))
print('Rated {0} with {1} stars.'.format(movie_idx[225], str(int(ratings[225]))))
print('Rated {0} with {1} stars.'.format(movie_idx[354], str(int(ratings[354]))))
Rated Toy Story (1995) with 4 stars.
Rated Twelve Monkeys (1995) with 3 stars.
Rated Usual Suspects, The (1995) with 5 stars.
Rated Outbreak (1995) with 4 stars.
Rated Shawshank Redemption, The (1994) with 5 stars.
Rated While You Were Sleeping (1995) with 3 stars.
Rated Forrest Gump (1994) with 5 stars.
Rated Silence of the Lambs, The (1991) with 2 stars.
Rated Alien (1979) with 4 stars.
Rated Die Hard 2 (1990) with 5 stars.
Rated Sphere (1998) with 5 stars.
We can add this custom ratings vector to the data set so it gets included in the model.
R = data['R']
Y = data['Y']
Y = np.append(Y, ratings, axis=1)
R = np.append(R, ratings != 0, axis=1)
We're now ready to train the collaborative filtering model. We're going to normalize the ratings and then run the optimization routine using our cost function, parameter vector, and data matrices at inputs.
from scipy.optimize import minimize
movies = Y.shape[0]
users = Y.shape[1]
features = 10
learning_rate = 10.
X = np.random.random(size=(movies, features))
Theta = np.random.random(size=(users, features))
params = np.concatenate((np.ravel(X), np.ravel(Theta)))
Ymean = np.zeros((movies, 1))
Ynorm = np.zeros((movies, users))
for i in range(movies):
    idx = np.where(R[i,:] == 1)[0]
    Ymean[i] = Y[i,idx].mean()
    Ynorm[i,idx] = Y[i,idx] - Ymean[i]
fmin = minimize(fun=cost, x0=params, args=(Ynorm, R, features, learning_rate),
                method='CG', jac=True, options={'maxiter': 100})
fmin
  status: 1
 success: False
    njev: 149
    nfev: 149
     fun: 38953.88249706676
       x: array([-0.07177334, -0.08315075,  0.1081135 , ...,  0.1817828 ,
        0.16873062,  0.03383596])
 message: 'Maximum number of iterations has been exceeded.'
     jac: array([ 0.01833555,  0.07377974,  0.03999323, ..., -0.00970181,
        0.00758961, -0.01181811])
Since everything was "unrolled" for the optimization routine to work properly, we need to reshape our matrices back to their original dimensions.
X = np.matrix(np.reshape(fmin.x[:movies * features], (movies, features)))
Theta = np.matrix(np.reshape(fmin.x[movies * features:], (users, features)))
X.shape, Theta.shape
((1682L, 10L), (944L, 10L))
Our trained parameters are now in X and Theta. We can use these to create some recommendations for the user we added earlier.
predictions = X * Theta.T
my_preds = predictions[:, -1] + Ymean
sorted_preds = np.sort(my_preds, axis=0)[::-1]
sorted_preds[:10]
matrix([[ 5.00000264],
        [ 5.00000249],
        [ 4.99999831],
        [ 4.99999671],
        [ 4.99999659],
        [ 4.99999253],
        [ 4.99999238],
        [ 4.9999915 ],
        [ 4.99999019],
        [ 4.99998643]]
That gives us an ordered list of the top ratings, but we lost what index those ratings are for. We actually need to use argsort so we know what movie the predicted rating corresponds to.
idx = np.argsort(my_preds, axis=0)[::-1]
print("Top 10 movie predictions:")
for i in range(10):
    j = int(idx[i])
    print('Predicted rating of {0} for movie {1}.'.format(str(float(my_preds[j])), movie_idx[j]))
Top 10 movie predictions:
Predicted rating of 5.00000264002 for movie Prefontaine (1997).
Predicted rating of 5.00000249142 for movie Santa with Muscles (1996).
Predicted rating of 4.99999831018 for movie Marlene Dietrich: Shadow and Light (1996) .
Predicted rating of 4.9999967124 for movie Saint of Fort Washington, The (1993).
Predicted rating of 4.99999658864 for movie They Made Me a Criminal (1939).
Predicted rating of 4.999992533 for movie Someone Else's America (1995).
Predicted rating of 4.99999238336 for movie Great Day in Harlem, A (1994).
Predicted rating of 4.99999149604 for movie Star Kid (1997).
Predicted rating of 4.99999018592 for movie Aiqing wansui (1994).
Predicted rating of 4.99998642746 for movie Entertaining Angels: The Dorothy Day Story (1996).
The recommended movies don't actually line up that well with what's in the exercise text. The reason why isn't too clear and I haven't found anything to account for it, but it's possible there's a mistake in the code somewhere. Bonus points if someone spots an error and points it out! Still, even if there's some minor difference the bulk of the example is accurate.
That concludes the last exercise! When I started this series, my goal was to become more proficient in python as well as refine the machine learning knowledge I'd gained from taking Andrew's class. I feel confident that I accomplished that goal. My hope though is that it's just as valuable to read as it was for me to create.